[macOS / iOS / Metal] GPU Debugging with XCode
Posted: Thu Aug 15, 2019 11:09 pm
XCode has automatic detection of Metal usage.
However often it breaks with Ogre so it will grey out the GPU Capture options.
Thus first you need to ensure Metal detection is forced.
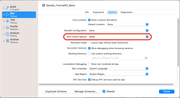
Go to Edit Scheme:
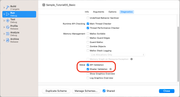
The Run->Options and select Metal in GPU Frame Capture.
Now run your Ogre app. Go back to XCode. Hit Debug -> Capture GPU Frame
Once it's done capturing, you can navigate the API calls (on the left). In this example I stopped right where the floor is being rendered and shows me the bound buffers.
From there you can inspect passBuf, materialArray, and even the generated shader
If we enter passBuf, you can see the values Metal registered. The horizontal row is hard to read straight, so I just copy pasting the contents somewhere else, IIRC you can also right click and save the contents as raw data.
In this case, passBuf is filled from C++ HlmsPbs::preparePassHash by uploading to *passBufferPtr++
For example C++ does:
If you see weird values on the GPU capture (like a light colour being a NaN, or being extremely large), probably there's an alignment issue going on (e.g. float3 will pad to float4) or the shader was generated with a variable that C++ is ignoring (e.g. the shader added a float but C++ forgot to take that into consideration)
You can also see the generated shader by double clicking on "main_metal" "Fragment Function" or "Vertex Function"
When it comes to debugging materialArray's values, it can be tricky because we perform materialArray[materialIdx]; so you need to somehow obtain the value of materialIdx used in the shader.
A workaround is to set hlmsPbs->setOptimizationStrategy( ConstBufferPool::LowerGpuOverhead ); which will force all shaders to use materialArray[0], making debugging much easier. Note however, Ogre may behave differently thus if you're unlucky the bug may not reproduce when setting that flag.
Big things to watchout:
See Hlms::setDebugOutputPath() to enable/disable and where these shaders should be dumped. If you set outputProperties to true, you can also check which properties were checked. That can help a lot in debugging.
Check in GPU Capture which shader filename is being used.
However often it breaks with Ogre so it will grey out the GPU Capture options.
Thus first you need to ensure Metal detection is forced.
Go to Edit Scheme:
From there you can inspect passBuf, materialArray, and even the generated shader
In this case, passBuf is filled from C++ HlmsPbs::preparePassHash by uploading to *passBufferPtr++
For example C++ does:
Code: Select all
//vec2 shadowRcv[numShadowMapLights].shadowDepthRange
Real fNear, fFar;
shadowNode->getMinMaxDepthRange( shadowMapTexIdx, fNear, fFar );
const Real depthRange = fFar - fNear;
*passBufferPtr++ = fNear;
*passBufferPtr++ = 1.0f / depthRange;
++passBufferPtr; //Padding
++passBufferPtr; //PaddingA workaround is to set hlmsPbs->setOptimizationStrategy( ConstBufferPool::LowerGpuOverhead ); which will force all shaders to use materialArray[0], making debugging much easier. Note however, Ogre may behave differently thus if you're unlucky the bug may not reproduce when setting that flag.
Big things to watchout:
- float3 followed by a float. float3 is promoted to float4 in Metal (padding)
- float3x3 is the same as three float4 in a row. There's a lot of padding there.
- End of structures. Structs are often padded to 16 bytes, thus the next variable starts at an alignment of 16 bytes
See Hlms::setDebugOutputPath() to enable/disable and where these shaders should be dumped. If you set outputProperties to true, you can also check which properties were checked. That can help a lot in debugging.
Check in GPU Capture which shader filename is being used.